
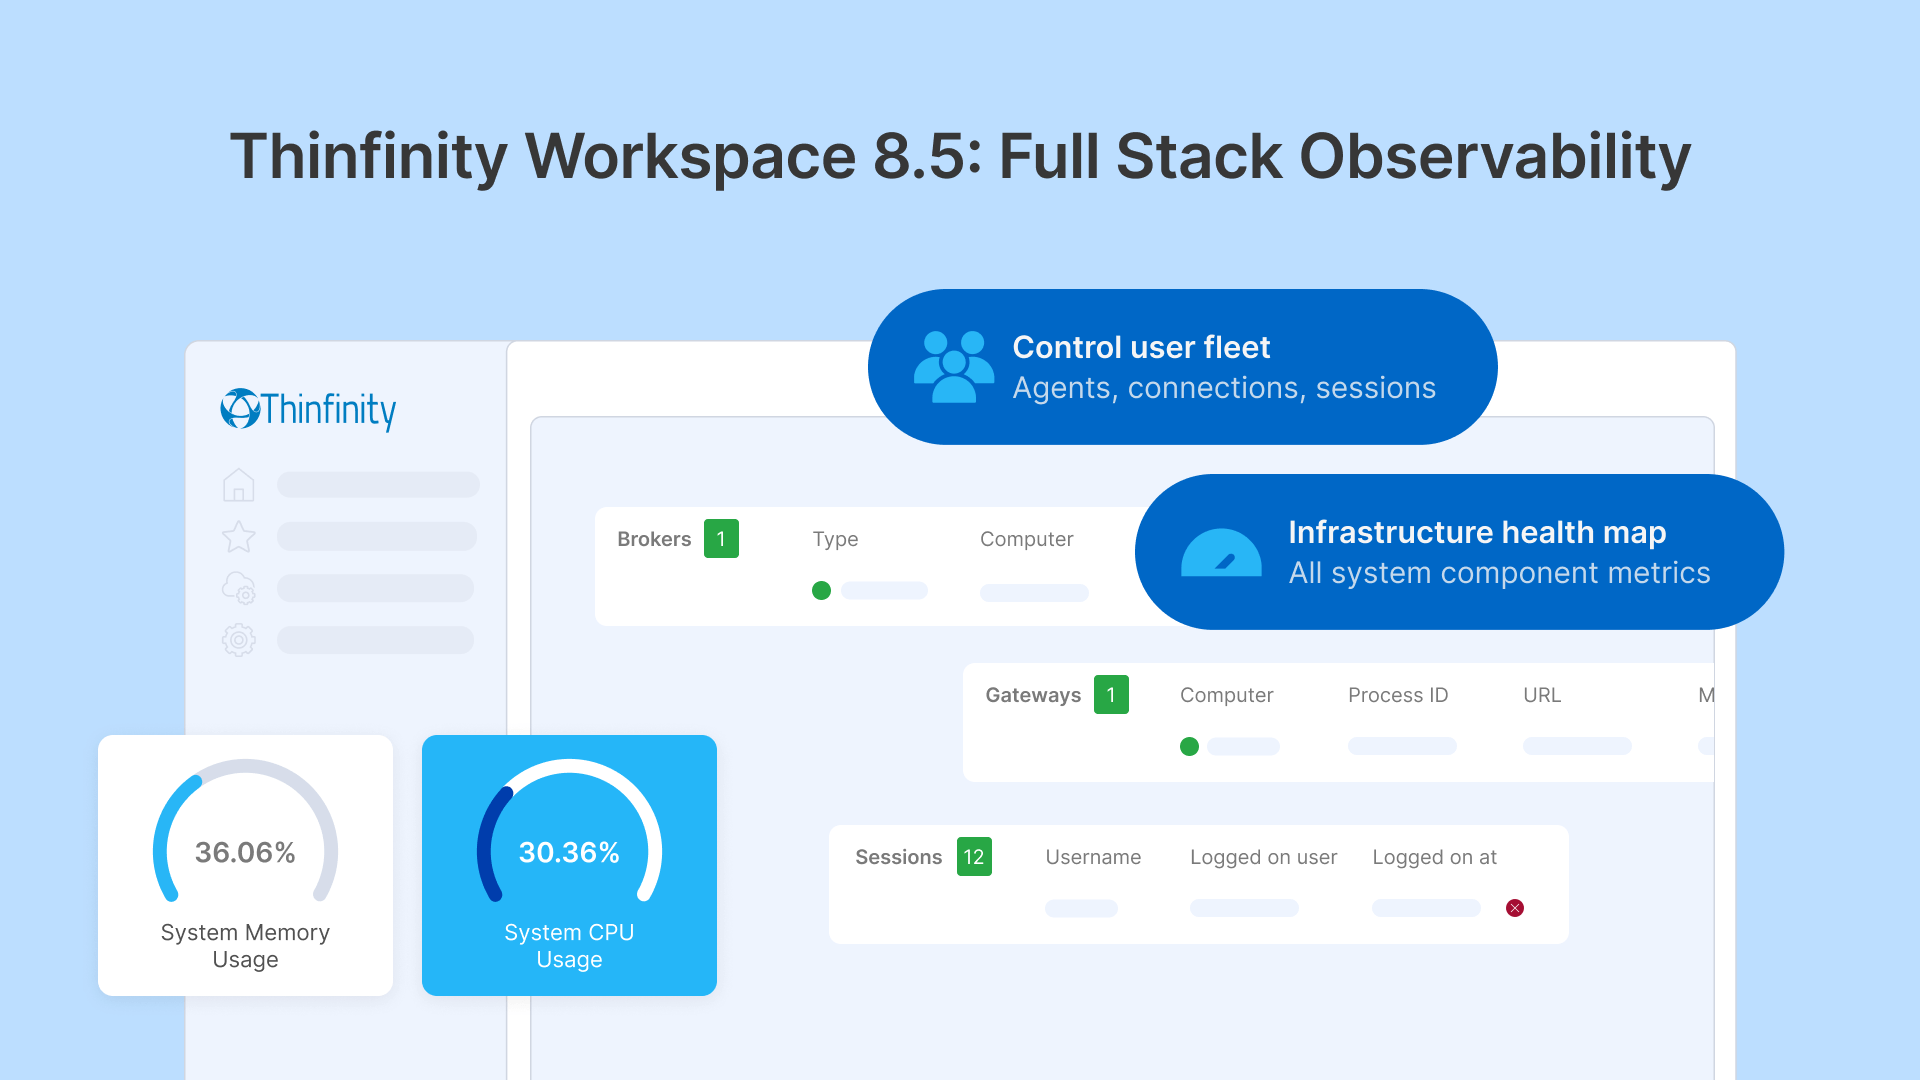
A New Era of Observability
Thinfinity Workspace 8.5 introduces real-time operational visibility across all its core components — Gateways, Brokers, Services, Agents, Connections, and Sessions.
The new Monitoring module provides IT administrators with a consolidated dashboard where every element of the infrastructure can be tracked live, ensuring faster troubleshooting, higher uptime, and complete transparency across distributed deployments.
Gateways: Network Health and System Utilization
The Gateways view displays each active gateway node in real time, showing critical resource indicators such as:
- Memory usage (MB / Total GB)
- CPU utilization
- System Memory and System CPU percentages
- Version and process ID
- Live service availability indicators (green/yellow/red)
Administrators can quickly verify the status of each gateway, validate build versions (e.g., 8.5 Build 108), and confirm operational health through resource graphs that dynamically update as load changes.
This visibility is essential for multi-node deployments or multi-region configurations, where gateway performance directly affects user connection quality.
Brokers: Session Orchestration Performance
The Brokers tab allows real-time supervision of broker nodes — the coordination layer of the Thinfinity architecture.
For each broker, the interface shows:
- Type (Primary / Secondary)
- Active clients and nodes
- Memory and CPU metrics
- System-wide resource indicators
- Version tracking for consistency across clusters
This enables administrators to monitor the performance and redundancy of their broker pool. Real-time metrics ensure that both active and standby brokers remain healthy, preventing bottlenecks in session brokering or connection queuing.
Services: Core Process and Module Monitoring
Every Thinfinity service — including Enterprise Logging, TLS Tunnel, Web Service API, Cloud Manager, and Remote Active Directory — can be monitored individually.
For each service, administrators can view:
- Process ID
- Version
- Registered Gateways
- Memory and CPU consumption per process
The result is a complete process-level map of the Thinfinity ecosystem. IT teams can detect misbehaving services, confirm API responsiveness, and ensure that all dependencies (such as TLS tunnels or Cloud Manager) are registered and running properly on every node.
Agents: VDI Node Resource Visibility
The Agents view provides real-time monitoring of all virtual desktop agents registered in the Thinfinity environment.
Each agent displays:
- Computer name and IP
- Assigned pool
- Process count
- Client count
- CPU and memory usage
- System resource gauges for CPU and memory
- Gateway registration status
This allows administrators to instantly identify underperforming or overloaded agents, ensuring balanced session distribution across the infrastructure.
A simple visual indicator confirms whether an agent is registered on all required gateways, making diagnostics and maintenance intuitive even in large-scale environments.
Connections: Live User Tracking
The Connections view offers a real-time list of all active sessions, with details such as:
- Profile name and username
- Origin host (From)
- Connection source (Browser or Native Client)
- Start time
- Instant disconnect control
This provides immediate insight into who is connected, from where, and through which method. Administrators can quickly terminate or audit sessions, supporting both operational control and security compliance.
The list automatically updates as users log in or out, giving IT teams an accurate pulse of activity across the environment.
Sessions: User Login Oversight
The Sessions tab focuses on logged-on user sessions, showing:
- Domain and username
- Logged-on user identity
- Login timestamp
- Session status
It enables administrators to cross-reference session duration, concurrency, and usage patterns, offering better visibility into licensing utilization and user behavior.
For organizations managing hundreds of concurrent sessions, this visibility translates into better scaling decisions and real-time security enforcement.
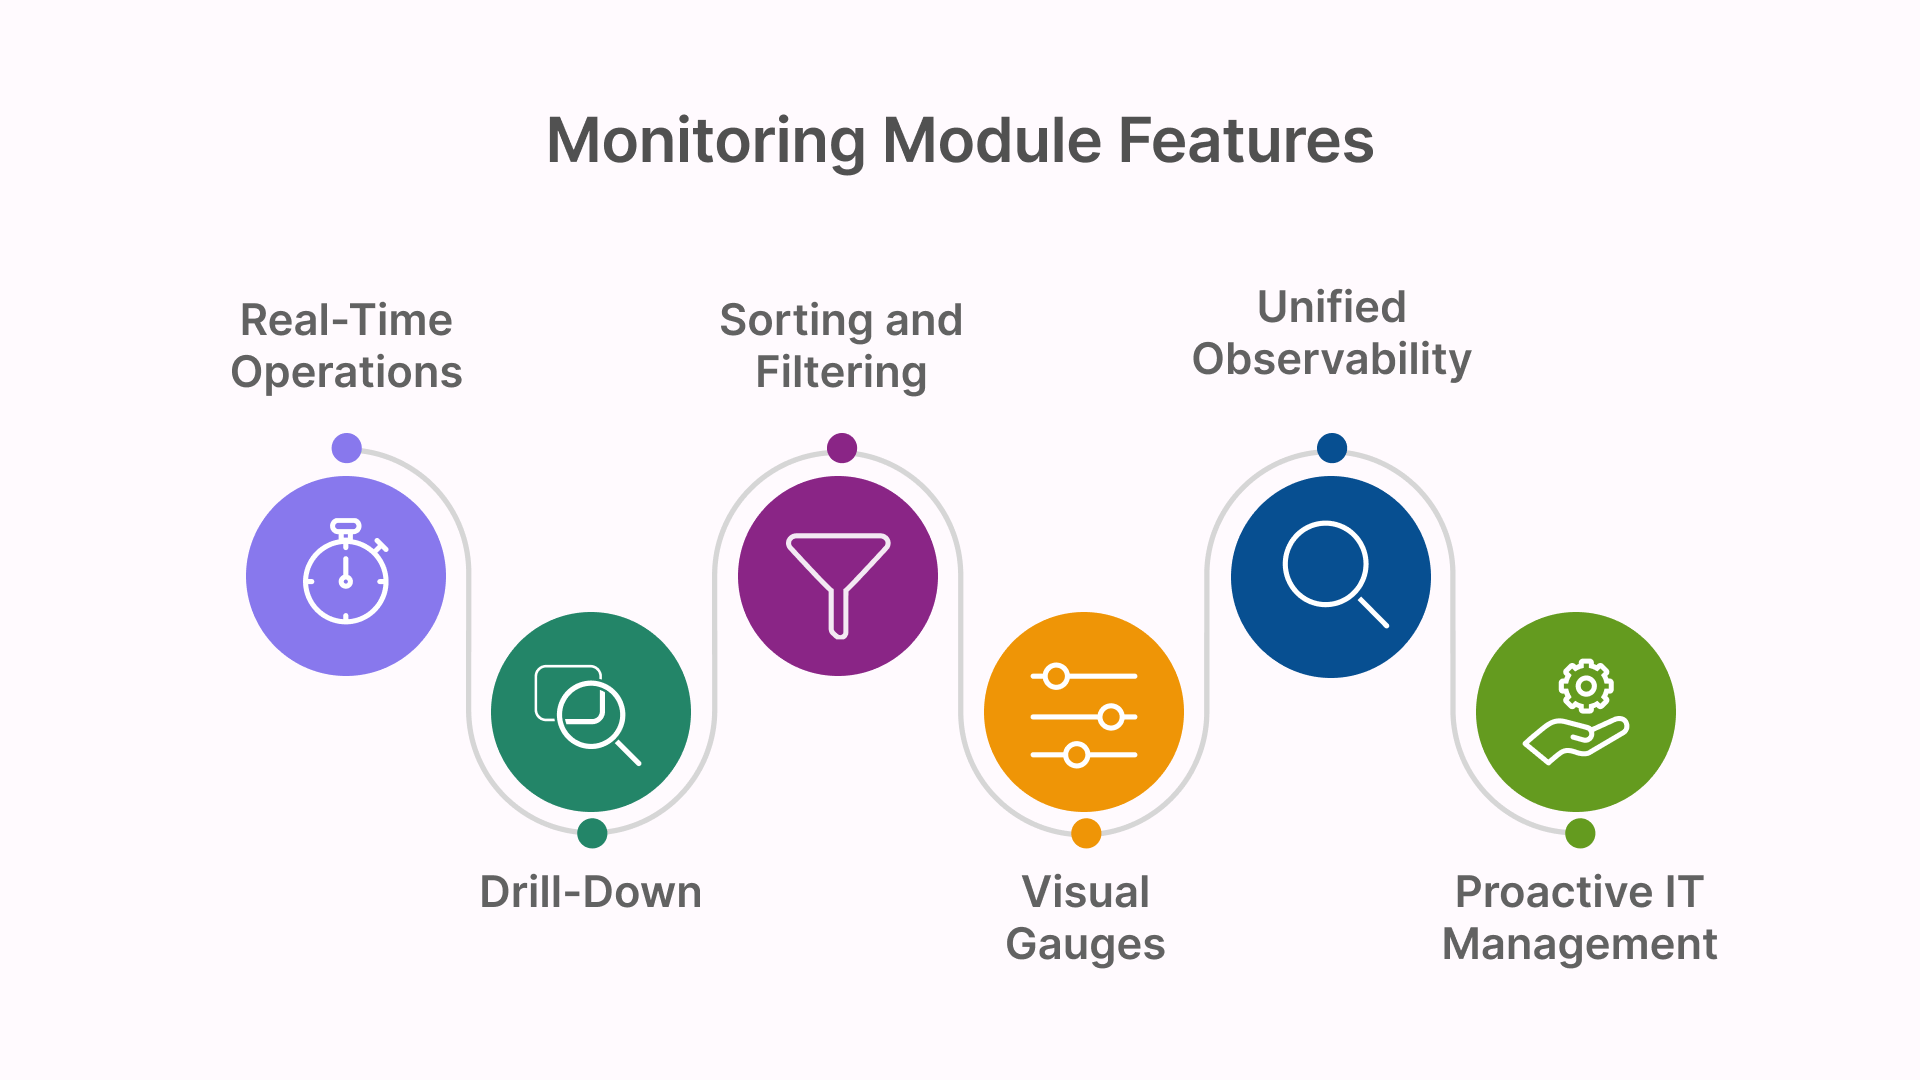
Designed for Real-Time Operations
All views in Thinfinity Workspace 8.5’s Monitoring module are live and synchronized, powered by real-time data streams.
Changes in CPU, memory, and connection state are reflected instantly, allowing administrators to make data-driven decisions without waiting for polling intervals or external reports.
The module also provides:
- Visual gauges for system health (CPU/memory percentages)
- Sorting and filtering across all columns for fast diagnostics
- Drill-down icons to inspect deeper performance metrics
This combination of granularity and live feedback transforms monitoring from a passive reporting tool into an active operational command center.
Unified Observability Across the Entire Stack
Thinfinity’s Monitoring module consolidates the full workspace lifecycle—from infrastructure to user sessions—into a single pane of glass.
By tracking every core element (Gateways, Brokers, Services, Agents, Connections, and Sessions) in real time, administrators gain the insight and control required to:
- Maintain uptime and service continuity
- Detect and mitigate issues before users are affected
- Optimize resource allocation across virtual machines
- Ensure compliance and auditing accuracy
In large distributed deployments—especially hybrid or multi-region configurations—this unified visibility becomes a cornerstone of proactive IT management.
In Summary
The Thinfinity Workspace 8.5 Monitoring module turns complex infrastructure management into a real-time, visual experience.
With live dashboards, process-level tracking, and actionable metrics, it empowers IT teams to maintain maximum performance, efficiency, and reliability across every Thinfinity component—from the gateway that handles user connections to the agents running virtual desktops.
Thinfinity doesn’t just deliver secure digital workspaces—it ensures they stay healthy, responsive, and observable at every second.